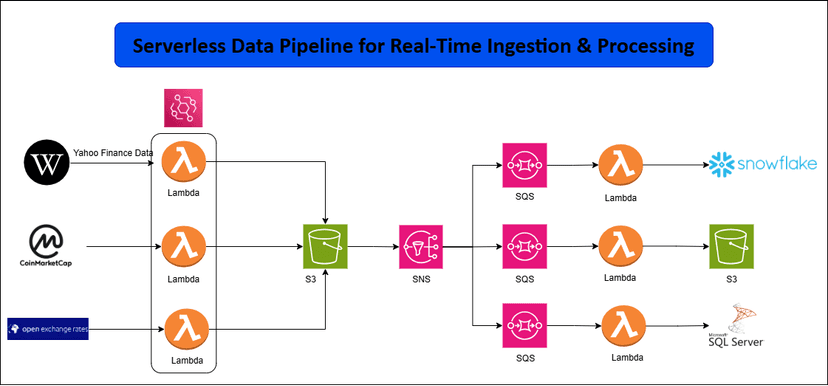
DataPulse: Real-Time Serverless Data Ingestion Pipeline
DataPulse automates real-time ingestion and processing of financial, crypto, and forex data using AWS Lambda, EventBridge, S3, SNS, and SQS, with optional transformations.

Data Warehousing for an Online Learning Platform
An automated ETL pipeline using PySpark, Airflow, and Snowflake to transform and load course data from CSV to a data warehouse for visualization in Power BI.

Data Sweeper
A Streamlit-based web app for seamless data cleaning and visualization. Upload CSV/Excel, remove duplicates, fill missing values, visualize data, and convert formats effortlessly.

Spotify Data ETL Pipeline
A serverless ETL pipeline integrating Spotify's API with AWS to fetch, transform, and load playlist data for queryable analytics using services like Lambda, S3, Glue, and Athena.

Pandemic Insights: ETL Pipeline with AWS Glue, Athena & Redshift
Developed a scalable ETL pipeline using AWS Glue, Athena, and Redshift to process and analyze COVID-19 data from multiple sources. Designed fact and dimension tables, optimized data queries, and loaded the results into Redshift for data-driven insights.

Serverless Data Lake Architecture on AWS
A fully automated serverless data lake solution using AWS services to ingest, process, and notify users about data transformations. This architecture leverages S3, Lambda, Glue Crawlers and Jobs, CloudWatch, and SNS to streamline ETL processes and deliver scalable data insights.

Dataflow Insights
DataFlow Insights is an automated data pipeline project that pushes daily data to Amazon S3, uses AWS Glue to catalog it, and Amazon Athena to query it. Finally, the data is visualized in Amazon QuickSight, creating a streamlined process for insightful data analysis and visualization.

Event-Driven Data Pipeline with AWS
Built a real-time data pipeline using AWS services including (S3, SNS, SQS, Lambda) to process events asynchronously, ensuring reliability, scalability, and fault tolerance. The architecture demonstrates an event-driven approach, where events in an S3 bucket trigger a flow through SNS, SQS, and Lambda, with the processed output stored back in S3.
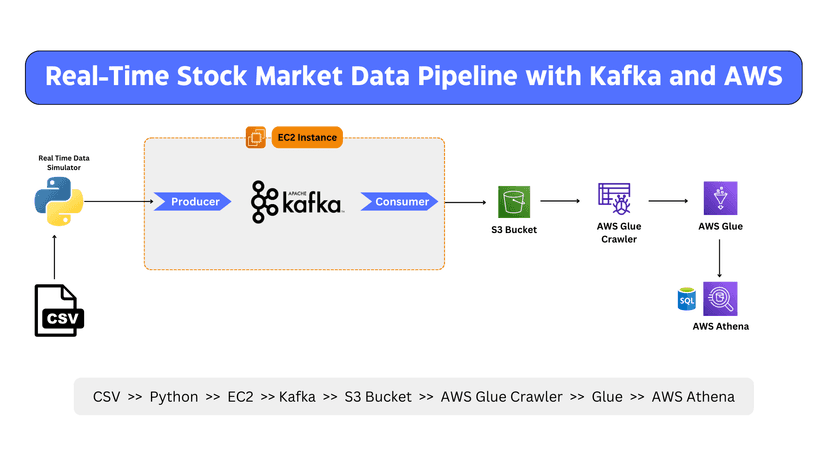
Real-Time Stock Market Data Pipeline
Built a real-time data pipeline for stock market data. It integrates Apache Kafka for data streaming and multiple AWS services for data storage and querying.

Weather and S3 Data Integration Pipeline
Developed a data pipeline using Apache Airflow on AWS EC2 to integrate weather data from OpenWeather API and Amazon S3 into an RDS PostgreSQL database. Transformed and joined data in parallel, with the final output stored in Amazon S3.

Real-Time Data Pipeline with SCD Implementation
Developed an end-to-end data pipeline that generates synthetic data using Python, extracts and transfers it via NiFi to S3, and ingests it into Snowflake using Snowpipe, with SCD Type 1 & 2 implementations for effective data tracking and management.

Real Estate Data Pipeline
This project implements a scalable data pipeline to extract, transform, and load real estate data from Redfin into Snowflake using AWS services. The data is later visualized in Power BI to provide insights into real estate trends.

Snowflake Multiple Data Loading Methods
The project involves using Snowflake's architecture for data ingestion, transformation, and visualization, integrating AWS services and local tools, with a focus on performance optimization and time travel.

E-Commerce Sales Analysis
The objective of this project is to analyze e-commerce sales data to derive meaningful insights that can help in making data-driven decisions to optimize business processes and strategies.

End-to-End Data Analysis Project
It demonstrates an end-to-end data analysis process using a dataset from Kaggle, involving data acquisition, cleaning, and analysis using Python, Pandas, and SQL.

Investigating Netflix Movies
The objective was to analyze trends in the duration of Netflix movies over the past decade using Python and various data analysis libraries.

GitHub History of Scala Language
This project leverages real-world repository data to analyze the development trajectory of Scala, highlighting key contributors and significant periods of activity.

